Data browser
Pom's main feature is the data browser. To set it up and generate content for it, use the following commands:
pom initialize— initialize a Pom project.pom add_source— tell Pom where to find tomograms and/or segmentations.pom summarize— take inventory of all tomograms and measure their composition via the segmentation volumes.pom projections— generate 2D projection images of all segmentations and a preview image for every tomogram.pom render— render segmentations in 3D, using scene compositions that can be defined in the data browser (see below).pom browse— launch the data browser.
Sources and file name conventions
Use pom add_source --tomograms ... to point at directories containing tomogram .mrc files. Whenever you run any other command, Pom will perform the requested job for every tomogram known to it via the added sources. Even before segmenting, you can run pom initialize; pom add_source --tomograms denoised/; pom summarize; pom projections; pom browse to launch the app and browse your data.
Use pom add_source --segmentations ... to let Pom know where to find segmentation .mrc files. Segmentations are linked to tomograms by file name: for any tomogram tomogram.mrc, segmentations must be named tomogram__feature.mrc, where feature can be any value (e.g. ribosome, nuclear_envelope, void). In easymode and Ais, output filenames follow this convention automatically.
Warp file name substitutions
In Warp, the pixel size is appended to the tomogram file name. For example, for TS_001.mdoc, the tomogram at 10 Å/px will be called TS_001_10.00Apx.mrc, while the corresponding tomogram star file is just TS_001.tomostar. Since easymode segment names its outputs based on the input .mrc file names, you end up with segmentations like TS_001_10.00Apx__ribosome.mrc.
This causes a mismatch when running pom contextualize on a Warp-compatible star file, where wrpMicrographName contains values like TS_001.tomostar. To bridge this, pom contextualize has a --substitutions argument. For example, to measure ribosome-to-membrane distances:
pom add_source --tomograms warp_tiltseries/reconstruction/
pom add_source --segmentations segmented/
pom contextualize --starfile ribosomes.star --substitutions .tomostar:_10.00Apx
3D visualization settings
With pom render you can define multiple scene compositions to render per tomogram. For example, you could render one scene called cytoskeleton featuring microtubules, intermediate filaments, and actin, and a second one called membranes featuring membranes only.
To configure this, run pom browse and go to the Visualization settings page. Under Image compositions, select add new composition, choose the segmented features to include, and give the composition a name. Under Feature library you can change the colour, threshold, postprocessing blur, and dust filter for each feature. The next time you run pom render, it will use these settings.
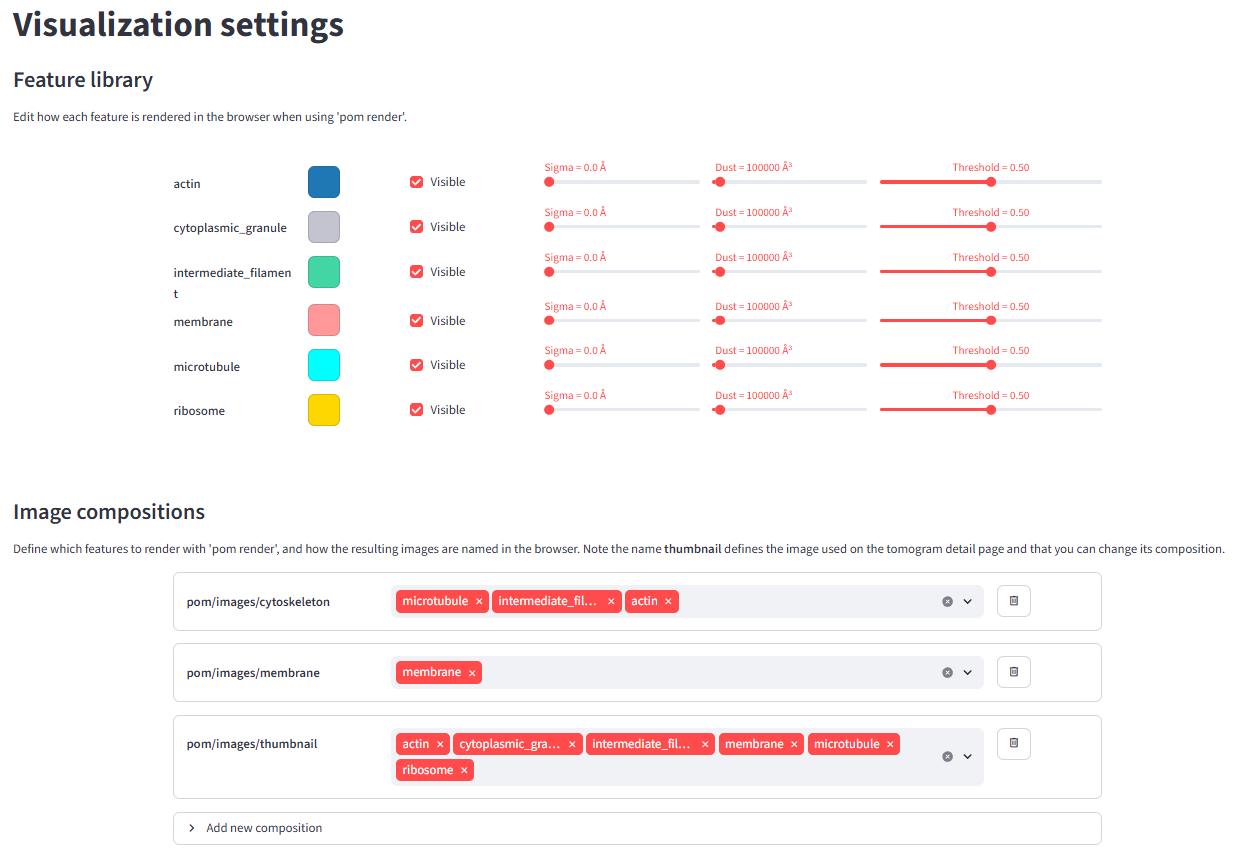
By default there is one composition called thumbnail, which is shown on the tomogram detail pages. The default features used in the thumbnail are rank1, rank2, rank3, etc. — meaning: render whichever feature is most abundant (or 2nd most, 3rd most, etc.) in each tomogram. You can exclude features from the ranking by un-checking the Visible box in the Feature library.